
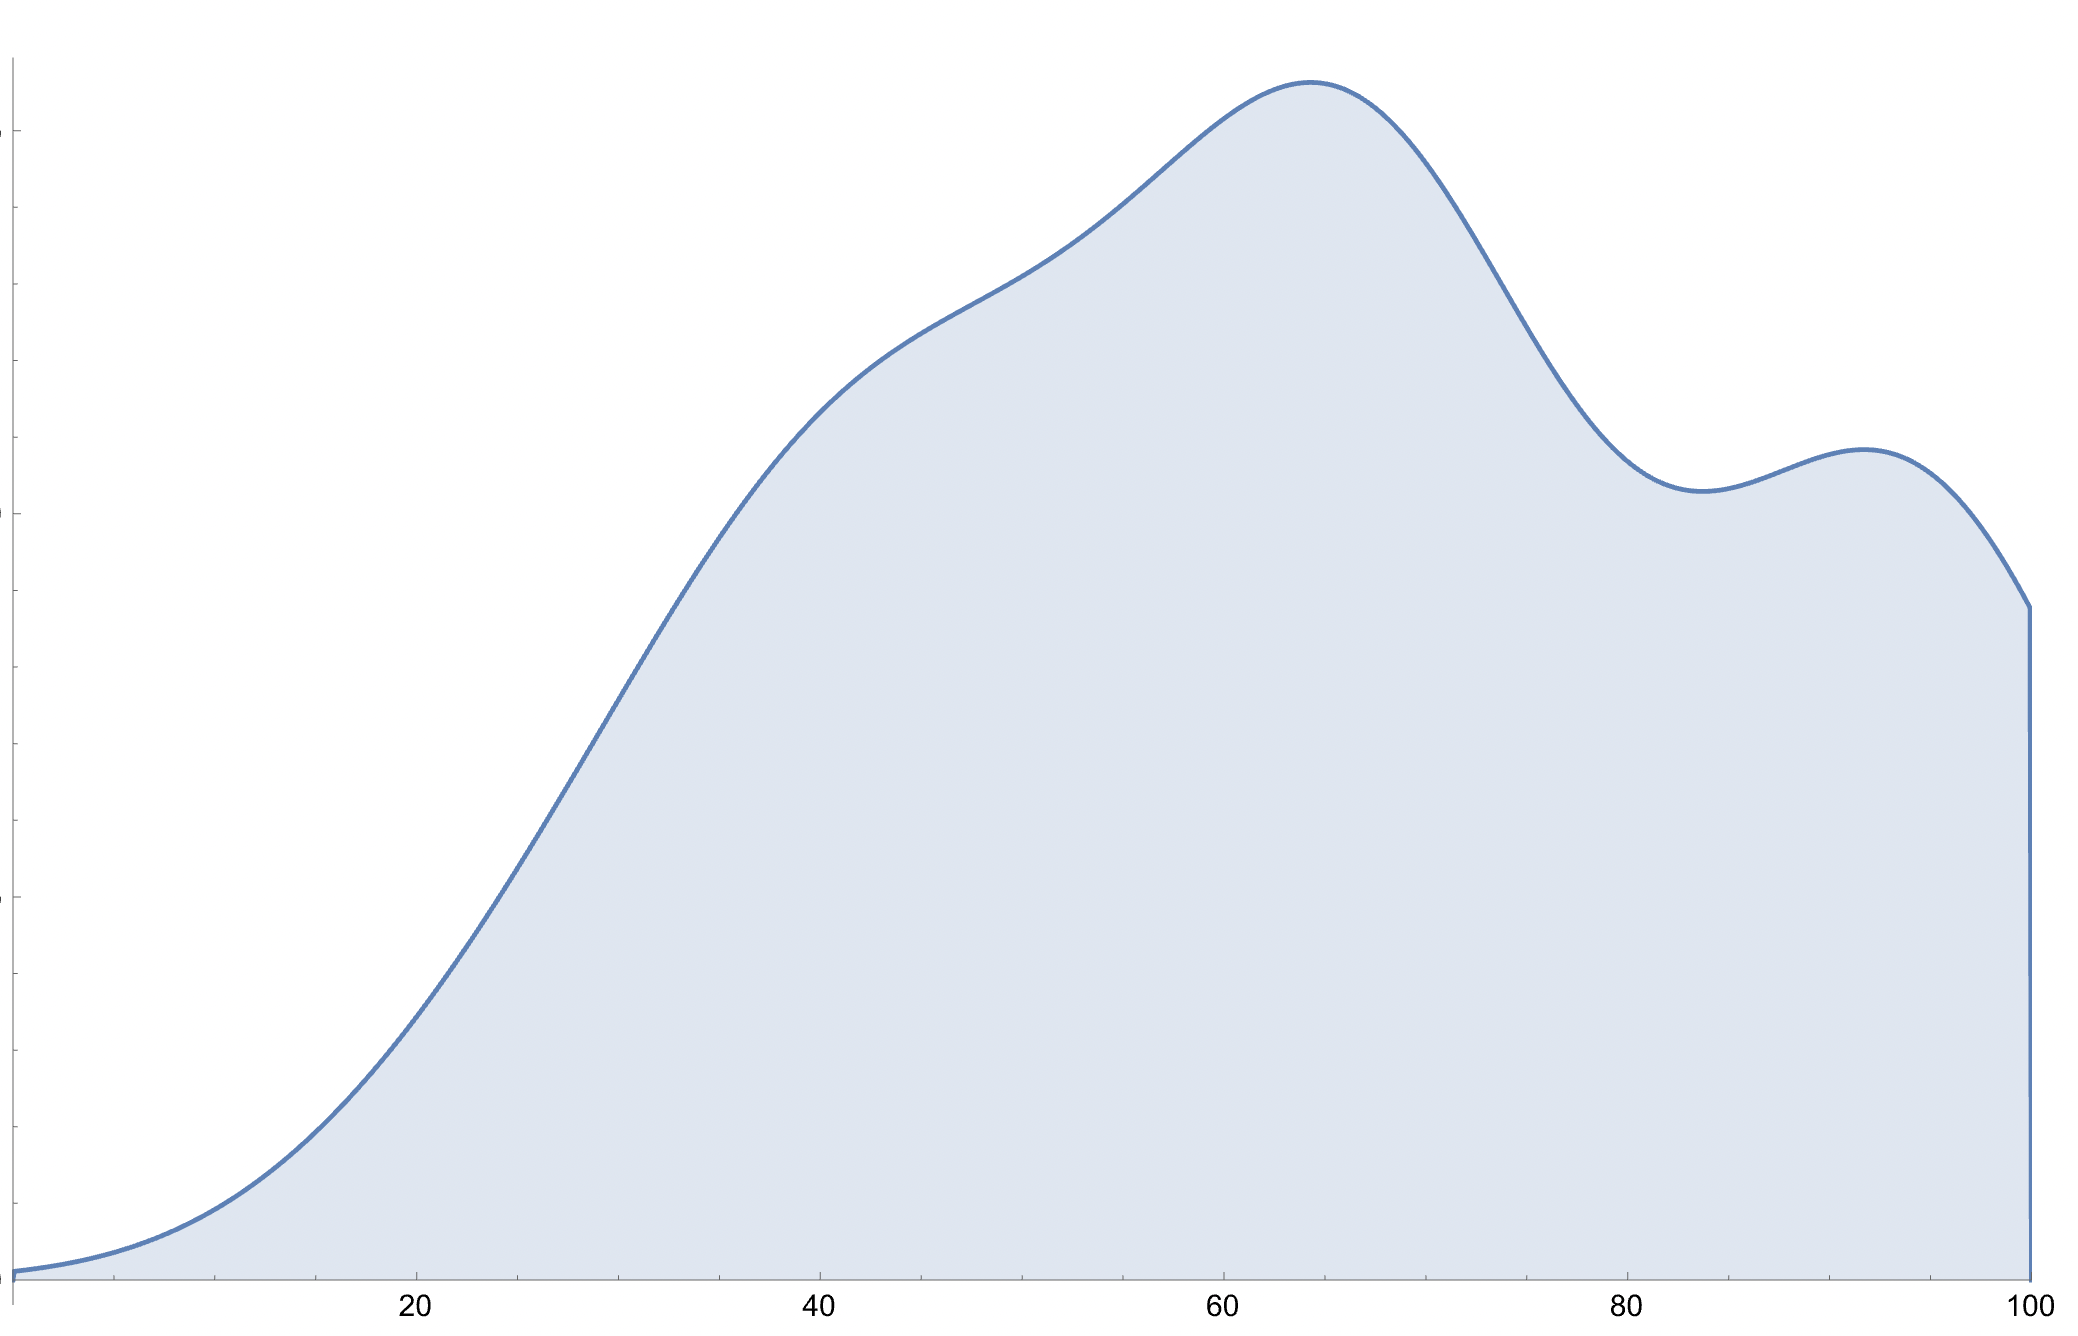
The mean for the midterm was 64 (by section: 59 for one section and 72 for the other). A smoothed density graph of the grades is as follows:
You can also find solutions at this link.
The mean for the midterm was 64 (by section: 59 for one section and 72 for the other). A smoothed density graph of the grades is as follows:
You can also find solutions at this link.